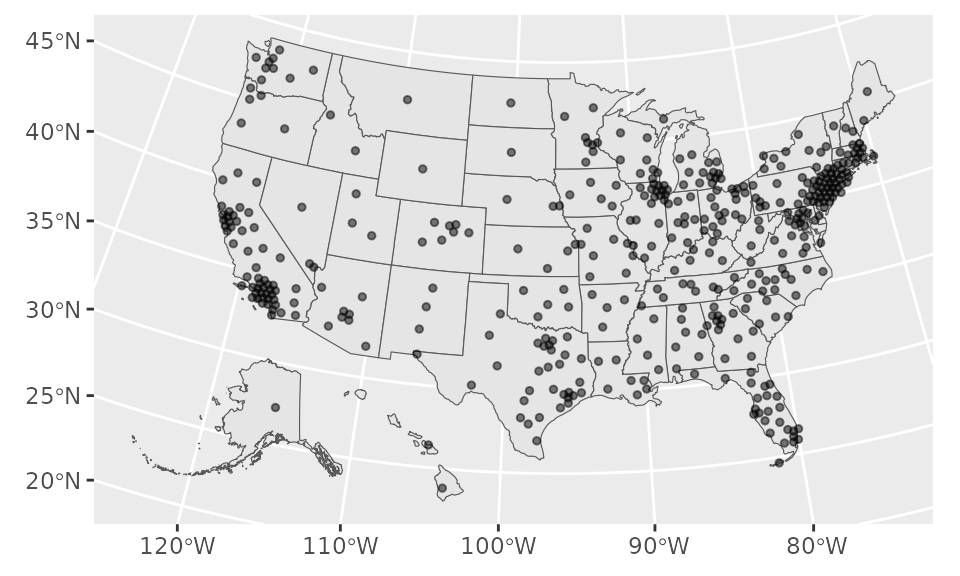
Shapefile of coordinates. Each row contains a coordinate of the centroid of the CD, slightly dodged so that points in dense places do not overlap.
Format
Each object is for a particular Congress. The year indicates the start of that Congress. Each observation is a congressional district, represented by a point.
Source
Coordinates from 2012 onwards taken from US Census, tigris package.
Coordinates from early Congresses taken from Jeffrey B. Lewis, historical congressional
district shapefiles
For 2027, we use tigris v.2.3.0 as of October 24 2026 to get the new centers in AL, CA, FL, LA, NC, OH, TN, TX, and UT, and reuse the previous cycle's dots for other states.
Examples
library(sf)
library(ggplot2)
shp_dot_2023
#> Simple feature collection with 435 features and 2 fields
#> Geometry type: POINT
#> Dimension: XY
#> Bounding box: xmin: -2288151 ymin: 118141.6 xmax: 2073753 ymax: 3105727
#> Projected CRS: NAD83 / Conus Albers
#> First 10 features:
#> cong cd geometry
#> 1 118 AK-01 POINT (-1935091 654711.3)
#> 2 118 AL-01 POINT (780145.2 921677.4)
#> 3 118 AL-02 POINT (934714.7 1007996)
#> 4 118 AL-03 POINT (947758.5 1172320)
#> 5 118 AL-04 POINT (799973.5 1270900)
#> 6 118 AL-05 POINT (852955.2 1339883)
#> 7 118 AL-06 POINT (851197.4 1185212)
#> 8 118 AL-07 POINT (783499.7 1078747)
#> 9 118 AR-01 POINT (421002.1 1377139)
#> 10 118 AR-02 POINT (328419.7 1351219)
# plot points combined with state outline
shp_dot_2005 |>
ggplot() +
geom_sf(data = shp_states) +
geom_sf(size = 1, alpha = 0.5)
 # can also use ggforce::geom_circle, extracting x,y coordinates from geom and
# setting a radius e.g. to 150000