fourthirtyfive is a R library collecting shapefiles, CD descriptors, and other data for the 435 congressional districts in the U.S. House, gathering good ideas from various authors.
It is created and maintained by Shiro Kuriwaki, with contributions from Cory McCartan, Zachary Donnini, Zoya Ahmer, featuring data made generously public by Jeffrey Lewis, The Downballot, and others. It also plays well with a standardized set of candidate election results and incumbency information, CAGE.
Installation
You can install the development version of fourthirtyfive from GitHub with:
# install.packages("devtools")
remotes::install_github("kuriwaki/fourthirtyfive")
Examples
Use the cd_ functions to retrieve district data. Type cd_ in RStudio to discover the family with autocomplete.
| Function | Returns |
|---|---|
cd_boundaries() |
Geographic district boundaries as an sf object |
cd_dotmap() |
Dodged district points as an sf object |
cd_hexmap() |
District hex cartograms as an sf object |
cd_names() |
Descriptive geographical district names as a tibble |
cd_normal_vote() |
Independently calculated presidential partisan lean, with source gaps flagged |
cd_available() |
A CLI summary and an invisible availability table |
Dot maps
We provide several types of maps. First, the dotmap is where one CD is treated as a point. We use the centroid of the actual map, and dodge it so that crowded points do not completely overlap with each other.
library(sf)
#> Linking to GEOS 3.12.1, GDAL 3.8.4, PROJ 9.4.0; sf_use_s2() is TRUE
library(ggplot2)

cd_dotmap(2023) |>
  ggplot() +
  geom_sf(data = shp_states) +
  geom_sf(size = 1, alpha = 0.5) +
  theme_void()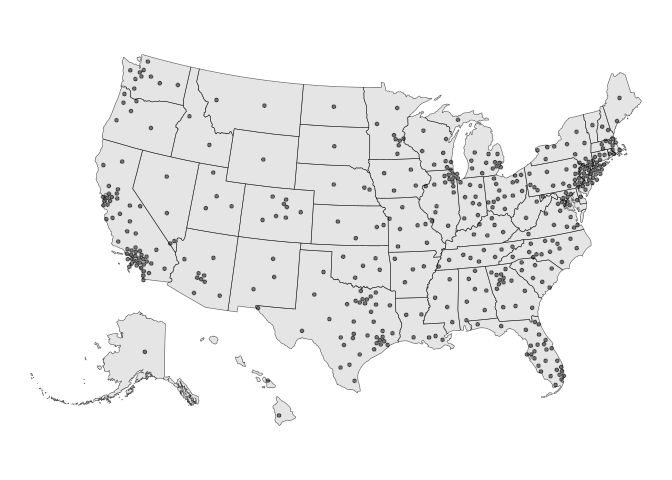
Hex maps
We also provide hexmaps (i.e., maps that present CDs as combinations of hexagons) for Congresses starting in 2005–2027. The 2013–2027 maps adapt Daniel Donner’s Congressional District Hexmap for The Downballot, licensed under Creative Commons Attribution 4.0 International (CC BY 4.0). The 2005–2011 maps reuse a 2009 map generated with Cory McCartan’s hexmap package, using The Downballot’s state layout for placement and scaling. The 2013–2021 maps also reuse one cartogram, so these historical hexmaps do not capture every mid-decade boundary change. See the licensing and modification notice for details.
cd_hexmap(2023) |>
  ggplot() +
  geom_sf() +
  theme_void() +
  labs(caption = "Map Source: https://the-db.co/maps")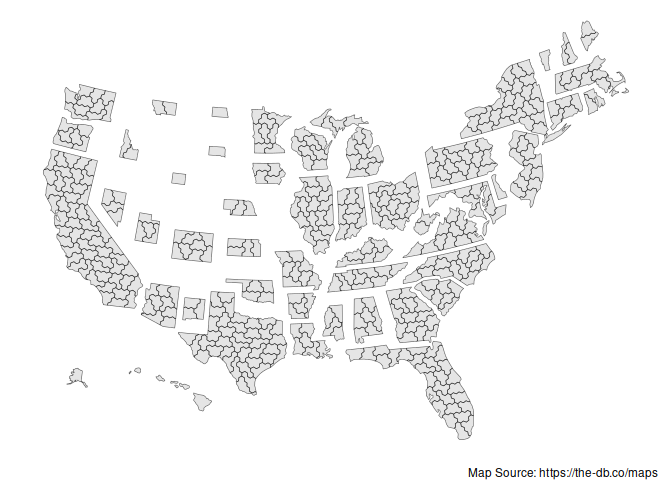
Note: An earlier version of these hex maps was provided in the donnermap package. Those shapefiles used unprojected coordinates that do not match the coordinate system of the other hex maps here. The hex maps in fourthirtyfive use the projected Web Mercator versions (wm suffix) from the Downballot.
Boundary maps
We do not store actual CD shapefiles, but we provide a function to draw these from either the Census or Jeff Lewis’s historical shapefiles.
cd_shps <- cd_boundaries(congress = 118)
cd_shps |>
  ggplot() +
  geom_sf() +
  theme_void()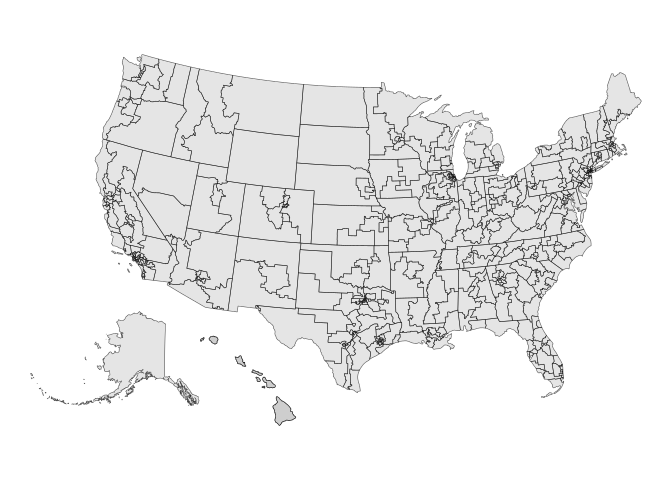
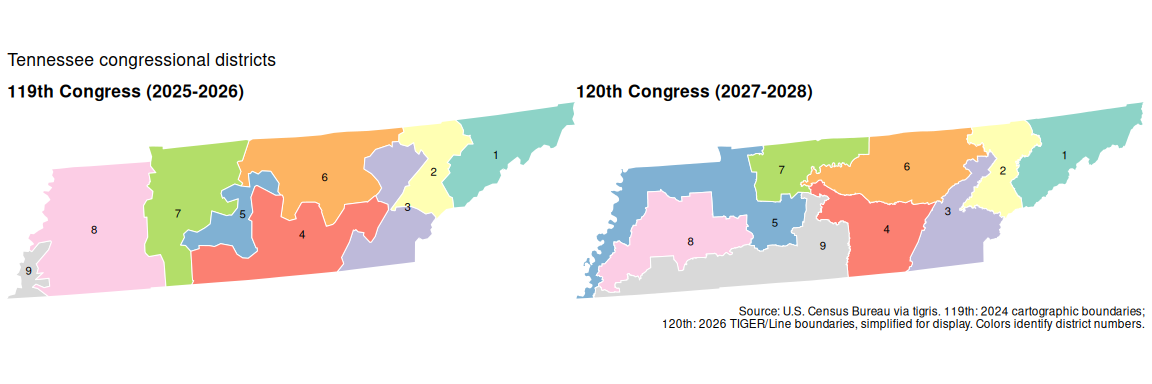
We can compare Tennessee’s district boundaries for the 119th and 120th Congresses. The maps use the same extent and district colors, with the 119th Congress on the left and the 120th on the right.
Interactive comparisons
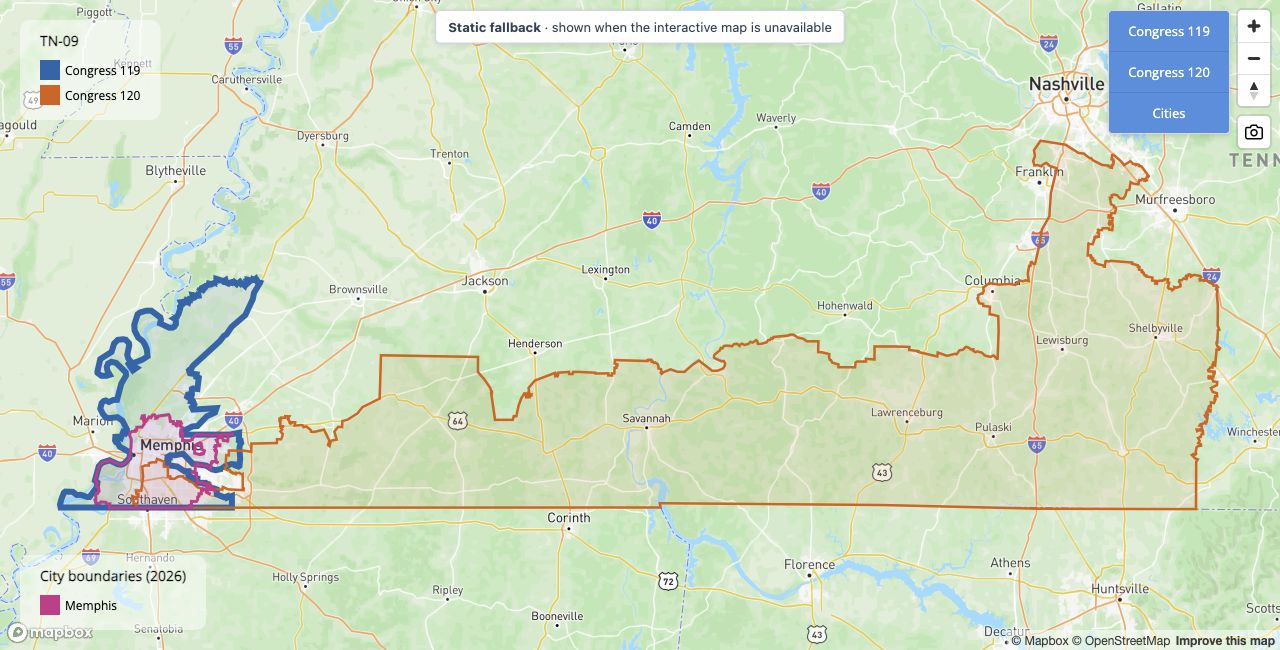
Mapbox is a recent tool that allows for interactive maps, so users can zoom into particular places and overlay them with real city names. The package provides a wrapper, cd_mapbox(), to do this. This tool is useful too to compare how much of a district overlaps with a city, or how redistricting has changed.
For example, compare Tennessee’s 9th district, represented by Steve Cohen in the 119th Congress, between the 2025 and 2027 maps.
We can zoom to Memphis by default too:
cd_mapbox(cd = "TN-09", congress = c(119, 120), cities = "Memphis", zoom_to_cities = TRUE, detailed = TRUE)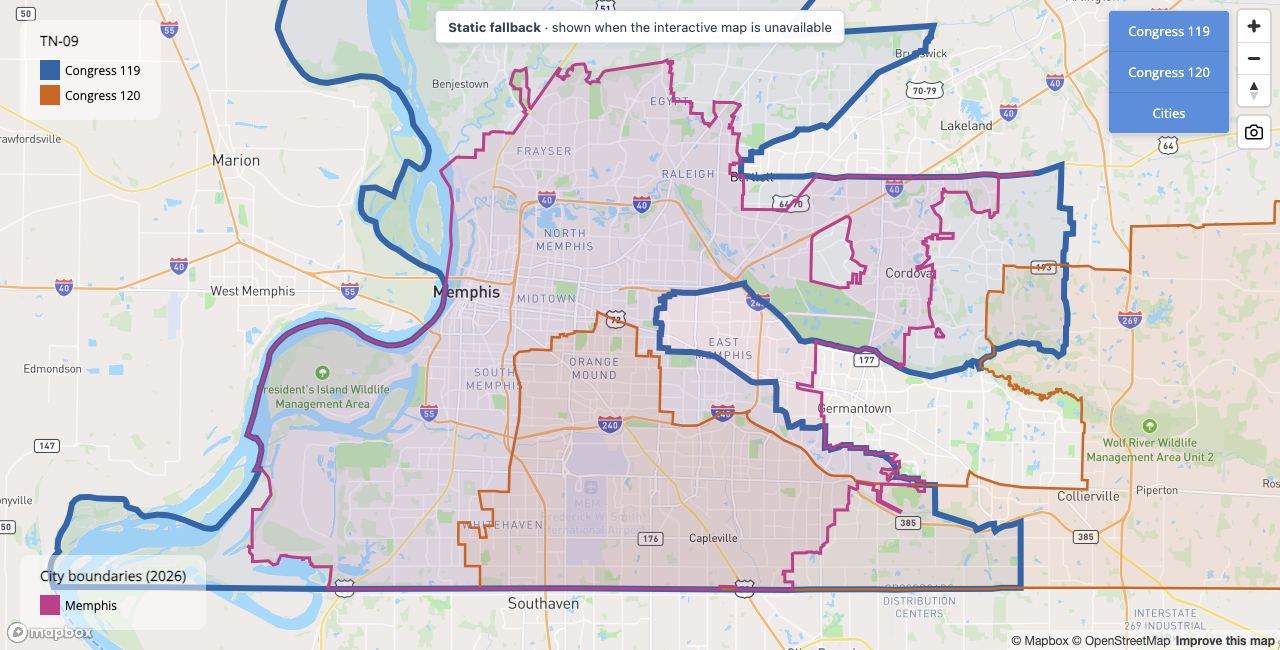
detailed = TRUE (the default) uses full-resolution Census TIGER/Line district boundaries for these interactive maps, including the 119th Congress. Use detailed = FALSE for smaller, generalized maps. Historical boundary precision still depends on the original source.
These interactive maps require the optional mapgl package and a Mapbox public token. See the Mapbox setup guide for installation, token configuration, and usage limits, or run help("mapbox-setup", package = "fourthirtyfive") in R.
Descriptive Names
We also provide a dataset of the descriptive names of each district (e.g., calling AZ-01 in the 110th Congress “Phoenix exurbs, Prescott, and Flagstaff”). These use Daily Kos names. Zachary Donnini supplied the 2005–2011 names.
cd_names(2007)
#> # A tibble: 435 × 3
#>     cong cd    cd_description
#>    <dbl> <chr> <chr>
#>  1   110 AK-01 All of Alaska
#>  2   110 AL-01 Southern Alabama
#>  3   110 AL-02 Southeast Alabama
#>  4   110 AL-03 East-central Alabama
#>  5   110 AL-04 North-central Alabama
#>  6   110 AL-05 Northern Alabama
#>  7   110 AL-06 Birmingham and Tuscaloosa suburbs
#>  8   110 AL-07 Birmingham, Tuscaloosa, and western Black Belt
#>  9   110 AR-01 Northeastern Arkansas
#> 10   110 AR-02 Greater Little Rock
#> # ℹ 425 more rows
Normal vote
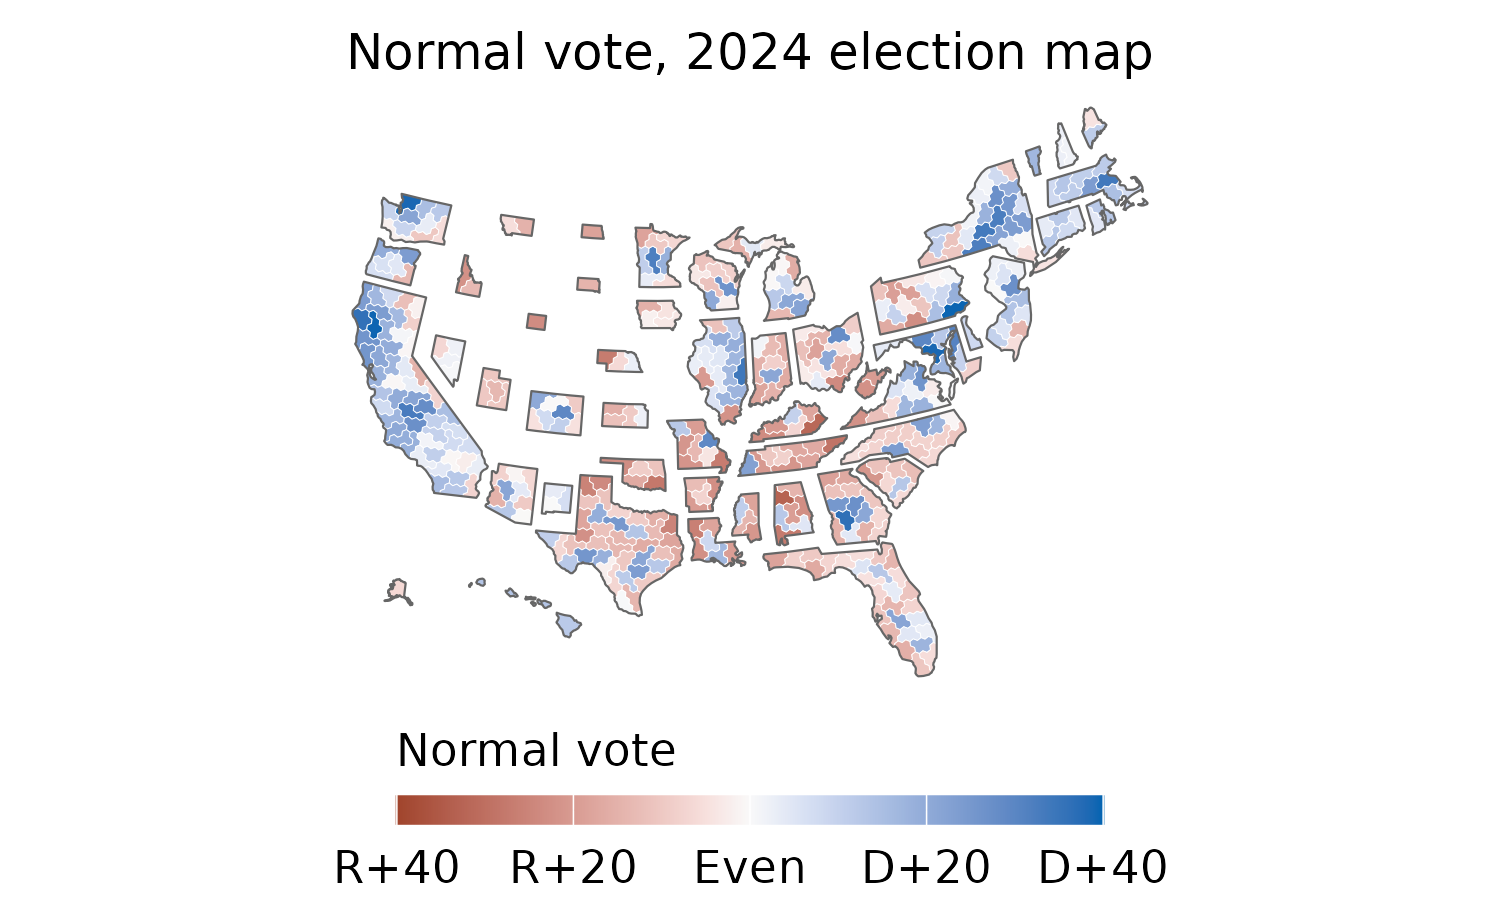
Use cd_normal_vote() to retrieve an independently calculated measure of presidential partisan lean. The calculation follows the publicly documented 75/25 methodology of the well-known Cook Partisan Voting Index (Cook PVI). It averages the district’s Democratic two-party vote share relative to the national share in the two most recent presidential elections, weighting the newer election 75% and the older election 25%. +0.05 thus indicates five percentage points more Democratic than the nation, and -0.05 indicates five points more Republican.
The map below uses the 2024 election’s district boundaries, corresponding to year = 2025 / the 119th Congress, with 2020 and 2024 presidential returns available for all 435 districts. Cook’s PVI for the 2027 map can be obtained from their website but we do not download them here due to their stringent IP rules.
Show the R code for the normal-vote map
library(dplyr)
library(ggplot2)

hex_normal_vote <- cd_hexmap(year = 2025) |>
  left_join(
    cd_normal_vote(year = 2025) |> select(cong, cd, normal_vote),
    by = c("cong", "cd"), relationship = "one-to-one"
  ) |>
  mutate(state = substr(cd, 1, 2))

ggplot(hex_normal_vote) +
  ggredist::geom_district(
    aes(group = cd, fill = normal_vote), color = "white", linewidth = 0.1
  ) +
  ggredist::geom_district(
    aes(group = state), fill = NA, color = "grey40", linewidth = 0.25,
    show.legend = FALSE
  ) +
  labs(title = "Normal vote, 2024 election map") +
  ggredist::scale_fill_party_c(
    name = "Normal vote", midpoint = 0, limits = c(-0.4, 0.4),
    labels = ggredist::label_party_margin(midpoint = 0)
  ) +
  ggredist::theme_map(
    text = element_text(family = "sans", size = 11, color = "black"),
    plot.title = element_text(size = 12, hjust = 0.5),
    legend.position = "bottom",
    legend.title.position = "top",
    legend.text = element_text(size = 11, color = "black"),
    legend.title = element_text(size = 11, color = "black"),
    legend.key.width = grid::unit(1.2, "cm"),
    legend.key.height = grid::unit(0.25, "cm"),
    plot.margin = margin(2, 2, 2, 2)
  )
Year definition and availability
We name the datasets (shp_dot_**, info_**) by the year of the congress.
| Object | Congress | Years in Session | Year Elected | Year up for Election |
|---|---|---|---|---|
**_2005 |
109th | 2005-2006 | 2004 | 2006 |
**_2007 |
110th | 2007-2008 | 2006 | 2008 |
**_2009 |
111th | 2009-2010 | 2008 | 2010 |
**_2011 |
112th | 2011-2012 | 2010 | 2012 |
**_2013 |
113th | 2013-2014 | 2012 | 2014 |
**_2015 |
114th | 2015-2016 | 2014 | 2016 |
**_2017 |
115th | 2017-2018 | 2016 | 2018 |
**_2019 |
116th | 2019-2020 | 2018 | 2020 |
**_2021 |
117th | 2021-2022 | 2020 | 2022 |
**_2023 |
118th | 2023-2024 | 2022 | 2024 |
**_2025 |
119th | 2025-2026 | 2024 | 2026 |
**_2027 |
120th | 2027-2028 | 2026 | 2028 |
Currently most of the function covers the years above. You can run the following function for an overview:
fourthirtyfive::cd_available()
#>
#> ── Available congressional district data ──
#>
#> • `cd_boundaries()`: 1789-2027 (Congresses 1-120); Lewis / US Census.
#> • `cd_dotmap()`: 2005-2027 (Congresses 109-120); Lewis / US Census, dodged
#>   centroids.
#> • `cd_hexmap()`: 2005-2027 (Congresses 109-120); hexmap / The Downballot.
#> • `cd_names()`: 2005-2027 (Congresses 109-120); Daily Kos / The Downballot /
#>   contributors.
#> • `cd_normal_vote()`: 2013-2027 (Congresses 113-120); calculated from The
#>   Downballot; missing input pairs are NA.
#> Years refer to the start of a Congress, not its election year.
#> Historical hexmaps for 2005-2011 reuse the generated 2009 map.
#> Normal vote values require two presidential results on matching maps; missing
#> pairs are NA.
Licensing and attribution
The package’s R code is licensed under the MIT License. The Downballot-derived hexmap material, including that used in the README figures and the package logo, is licensed under CC BY 4.0. Credit: Congressional District Hexmap by Daniel Donner for The Downballot.
The package standardizes identifiers, repairs narrow geometry gaps, translates the 2023 cartogram, and reuses cartograms for some historical Congresses. The normal-vote figure adds partisan colors; the logo recolors and crops the hex cartogram and combines it with a geographic map. The CC BY notice covers the Downballot-derived map material. The presidential vote inputs and Mapbox basemap have separate source and reuse information.
Full credits and modifications are recorded in LICENSE.note, which is also included in the installed package. When sharing a figure or sticker separately, include the creator credit, source and license links, and an indication of changes in its accompanying credits.
AI assistance for this package
Frontier AI models wrote a large share of package code, documentation, data collection and preparation, and checks of district descriptions and map geometry. These contributions are documented in the public Github source code. The human authors reviewed the output and core functionalities of the code, to vouch for the package’s content and accuracy. Data sources and contributors are credited in the relevant documentation.