Retrieve a district's or state's presidential voting lean relative to the nation, following the publicly documented 75/25 methodology of the well-known Cook Partisan Voting Index (Cook PVI). Values are calculated independently from public election results. The returned numeric measure is a signed proportion: positive values indicate a Democratic lean and negative values indicate a Republican lean.
Usage
cd_normal_vote(
  year = NULL,
  congress = NULL,
  geography = c("district", "state")
)
Source
District presidential results from The Downballot.
Arguments
- year
Congress start years. For example,
2025selects districts used in the 2024 House election. Omit bothyearandcongressto return all bundled Congresses. If both are supplied,yeartakes precedence.- congress
Integer vector of Congress numbers, such as
119orc(119, 120).- geography
"district"for House districts or"state"for the 50 states and DC.
Value
A tibble with the columns documented in normal_vote.
Details
For each of the two most recent presidential elections as of the regular House election, calculate Democratic two-party vote share, and label them X2 (older) and X1 (newer). Then we compute the normal vote as 0.25*(X2 - Avg(X2)) + 0.75*(X1 - Avg(X1)) where the Avg( ) operator indicates the national popular vote (not exactly, but close to, an average of the 435 districts). As noted above, this follows the method of the Cook PVI.
In light of the intellectual-property language in The Cook Political Report's terms and conditions, we chose not to distribute its publicly available PVI scores in this package. Instead, we calculate district values using The Downballot's compilation. Presidential vote is not regularly computed by congressional district. We are grateful for Downballot's substantial work and for their generous reuse policy, which welcomes reuse with a citation and a source link. These independently calculated values may differ from Cook's published scores because the underlying vote allocations can differ. The Downballot's compilation does not yet provide both 2020 and 2024 presidential results for all redrawn 2027 districts. Cook's published PVI scores for that map can be obtained publicly from its district page (published July 2026).
See also
normal_vote for columns and missingness.
Other congressional district functions:
cd_available(),
cd_boundaries(),
cd_dotmap(),
cd_hexmap(),
cd_mapbox(),
cd_names()
Examples
cd_normal_vote(year = 2025)
#> # A tibble: 435 × 8
#>     cong election_year geography state cd    normal_vote status     accessed
#>    <int>         <int> <chr>     <chr> <chr>       <dbl> <chr>      <date>
#>  1   119          2024 district  AK    AK-01     -0.0646 calculated 2026-10-27
#>  2   119          2024 district  AL    AL-01     -0.273  calculated 2026-10-27
#>  3   119          2024 district  AL    AL-02      0.0468 calculated 2026-10-27
#>  4   119          2024 district  AL    AL-03     -0.228  calculated 2026-10-27
#>  5   119          2024 district  AL    AL-04     -0.329  calculated 2026-10-27
#>  6   119          2024 district  AL    AL-05     -0.145  calculated 2026-10-27
#>  7   119          2024 district  AL    AL-06     -0.194  calculated 2026-10-27
#>  8   119          2024 district  AL    AL-07      0.125  calculated 2026-10-27
#>  9   119          2024 district  AR    AR-01     -0.226  calculated 2026-10-27
#> 10   119          2024 district  AR    AR-02     -0.0766 calculated 2026-10-27
#> # ℹ 425 more rows
cd_normal_vote(congress = 119, geography = "state")
#> # A tibble: 51 × 8
#>     cong election_year geography state cd    normal_vote status     accessed
#>    <int>         <int> <chr>     <chr> <chr>       <dbl> <chr>      <date>
#>  1   119          2024 state     AK    NA        -0.0646 calculated 2026-10-27
#>  2   119          2024 state     AL    NA        -0.148  calculated 2026-10-27
#>  3   119          2024 state     AR    NA        -0.153  calculated 2026-10-27
#>  4   119          2024 state     AZ    NA        -0.0206 calculated 2026-10-27
#>  5   119          2024 state     CA    NA         0.115  calculated 2026-10-27
#>  6   119          2024 state     CO    NA         0.0596 calculated 2026-10-27
#>  7   119          2024 state     CT    NA         0.0808 calculated 2026-10-27
#>  8   119          2024 state     DC    NA         0.436  calculated 2026-10-27
#>  9   119          2024 state     DE    NA         0.0801 calculated 2026-10-27
#> 10   119          2024 state     FL    NA        -0.0539 calculated 2026-10-27
#> # ℹ 41 more rows

library(dplyr)
#>
#> Attaching package: ‘dplyr’
#> The following objects are masked from ‘package:stats’:
#>
#>     filter, lag
#> The following objects are masked from ‘package:base’:
#>
#>     intersect, setdiff, setequal, union
library(ggplot2)

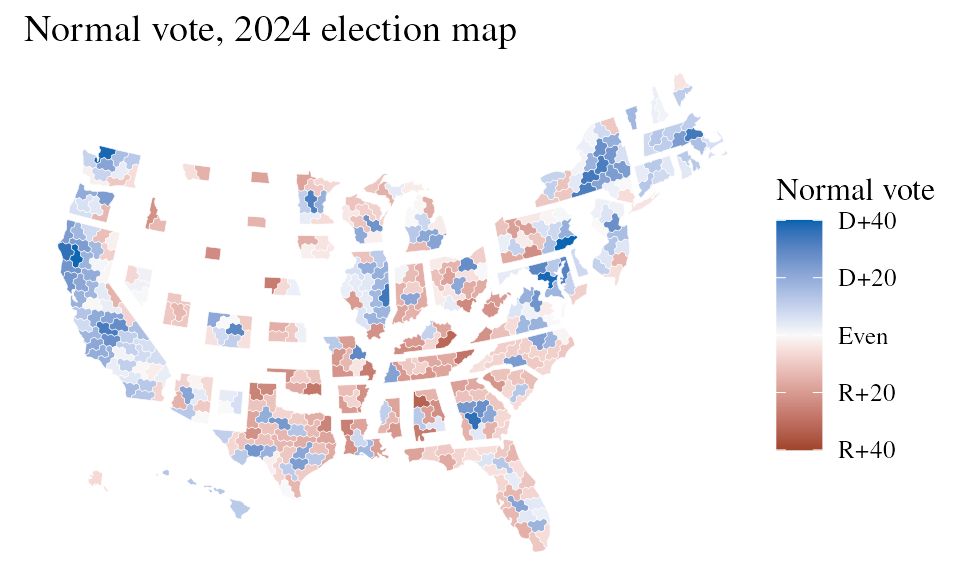
hex_normal_vote <- cd_hexmap(year = 2025) |>
  left_join(
    cd_normal_vote(year = 2025) |> select(cong, cd, normal_vote),
    by = c("cong", "cd"), relationship = "one-to-one"
  )

ggplot(hex_normal_vote, aes(group = cd, fill = normal_vote)) +
  ggredist::geom_district(color = "white", linewidth = 0.1) +
  labs(title = "Normal vote, 2024 election map") +
  ggredist::scale_fill_party_c(
    name = "Normal vote", midpoint = 0, limits = c(-0.4, 0.4),
    labels = ggredist::label_party_margin(midpoint = 0)
  ) +
  ggredist::theme_map()